Understanding a Septic System Design in New Hampshire: What the Engineering Plans Really Tell Us
When purchasing a home or vacant land in New Hampshire, understanding the septic system is an important part of knowing what you're buying. But how much can you actually learn from a septic design? Quite a lot.
Most buyers have seen a septic plan at some point. It's usually a large engineering drawing covered with lines, measurements, soil information, elevations, and technical notes.
And for many people, it's difficult to make sense of.
They recognize the house, the septic tank, and perhaps the location of the leach field. Everything else can look like a confusing collection of numbers.
But those numbers tell an important story.
They explain how much wastewater the system is designed to handle, what the soil conditions are like, how deep groundwater might be, where the system can be installed, and how the different components work together.
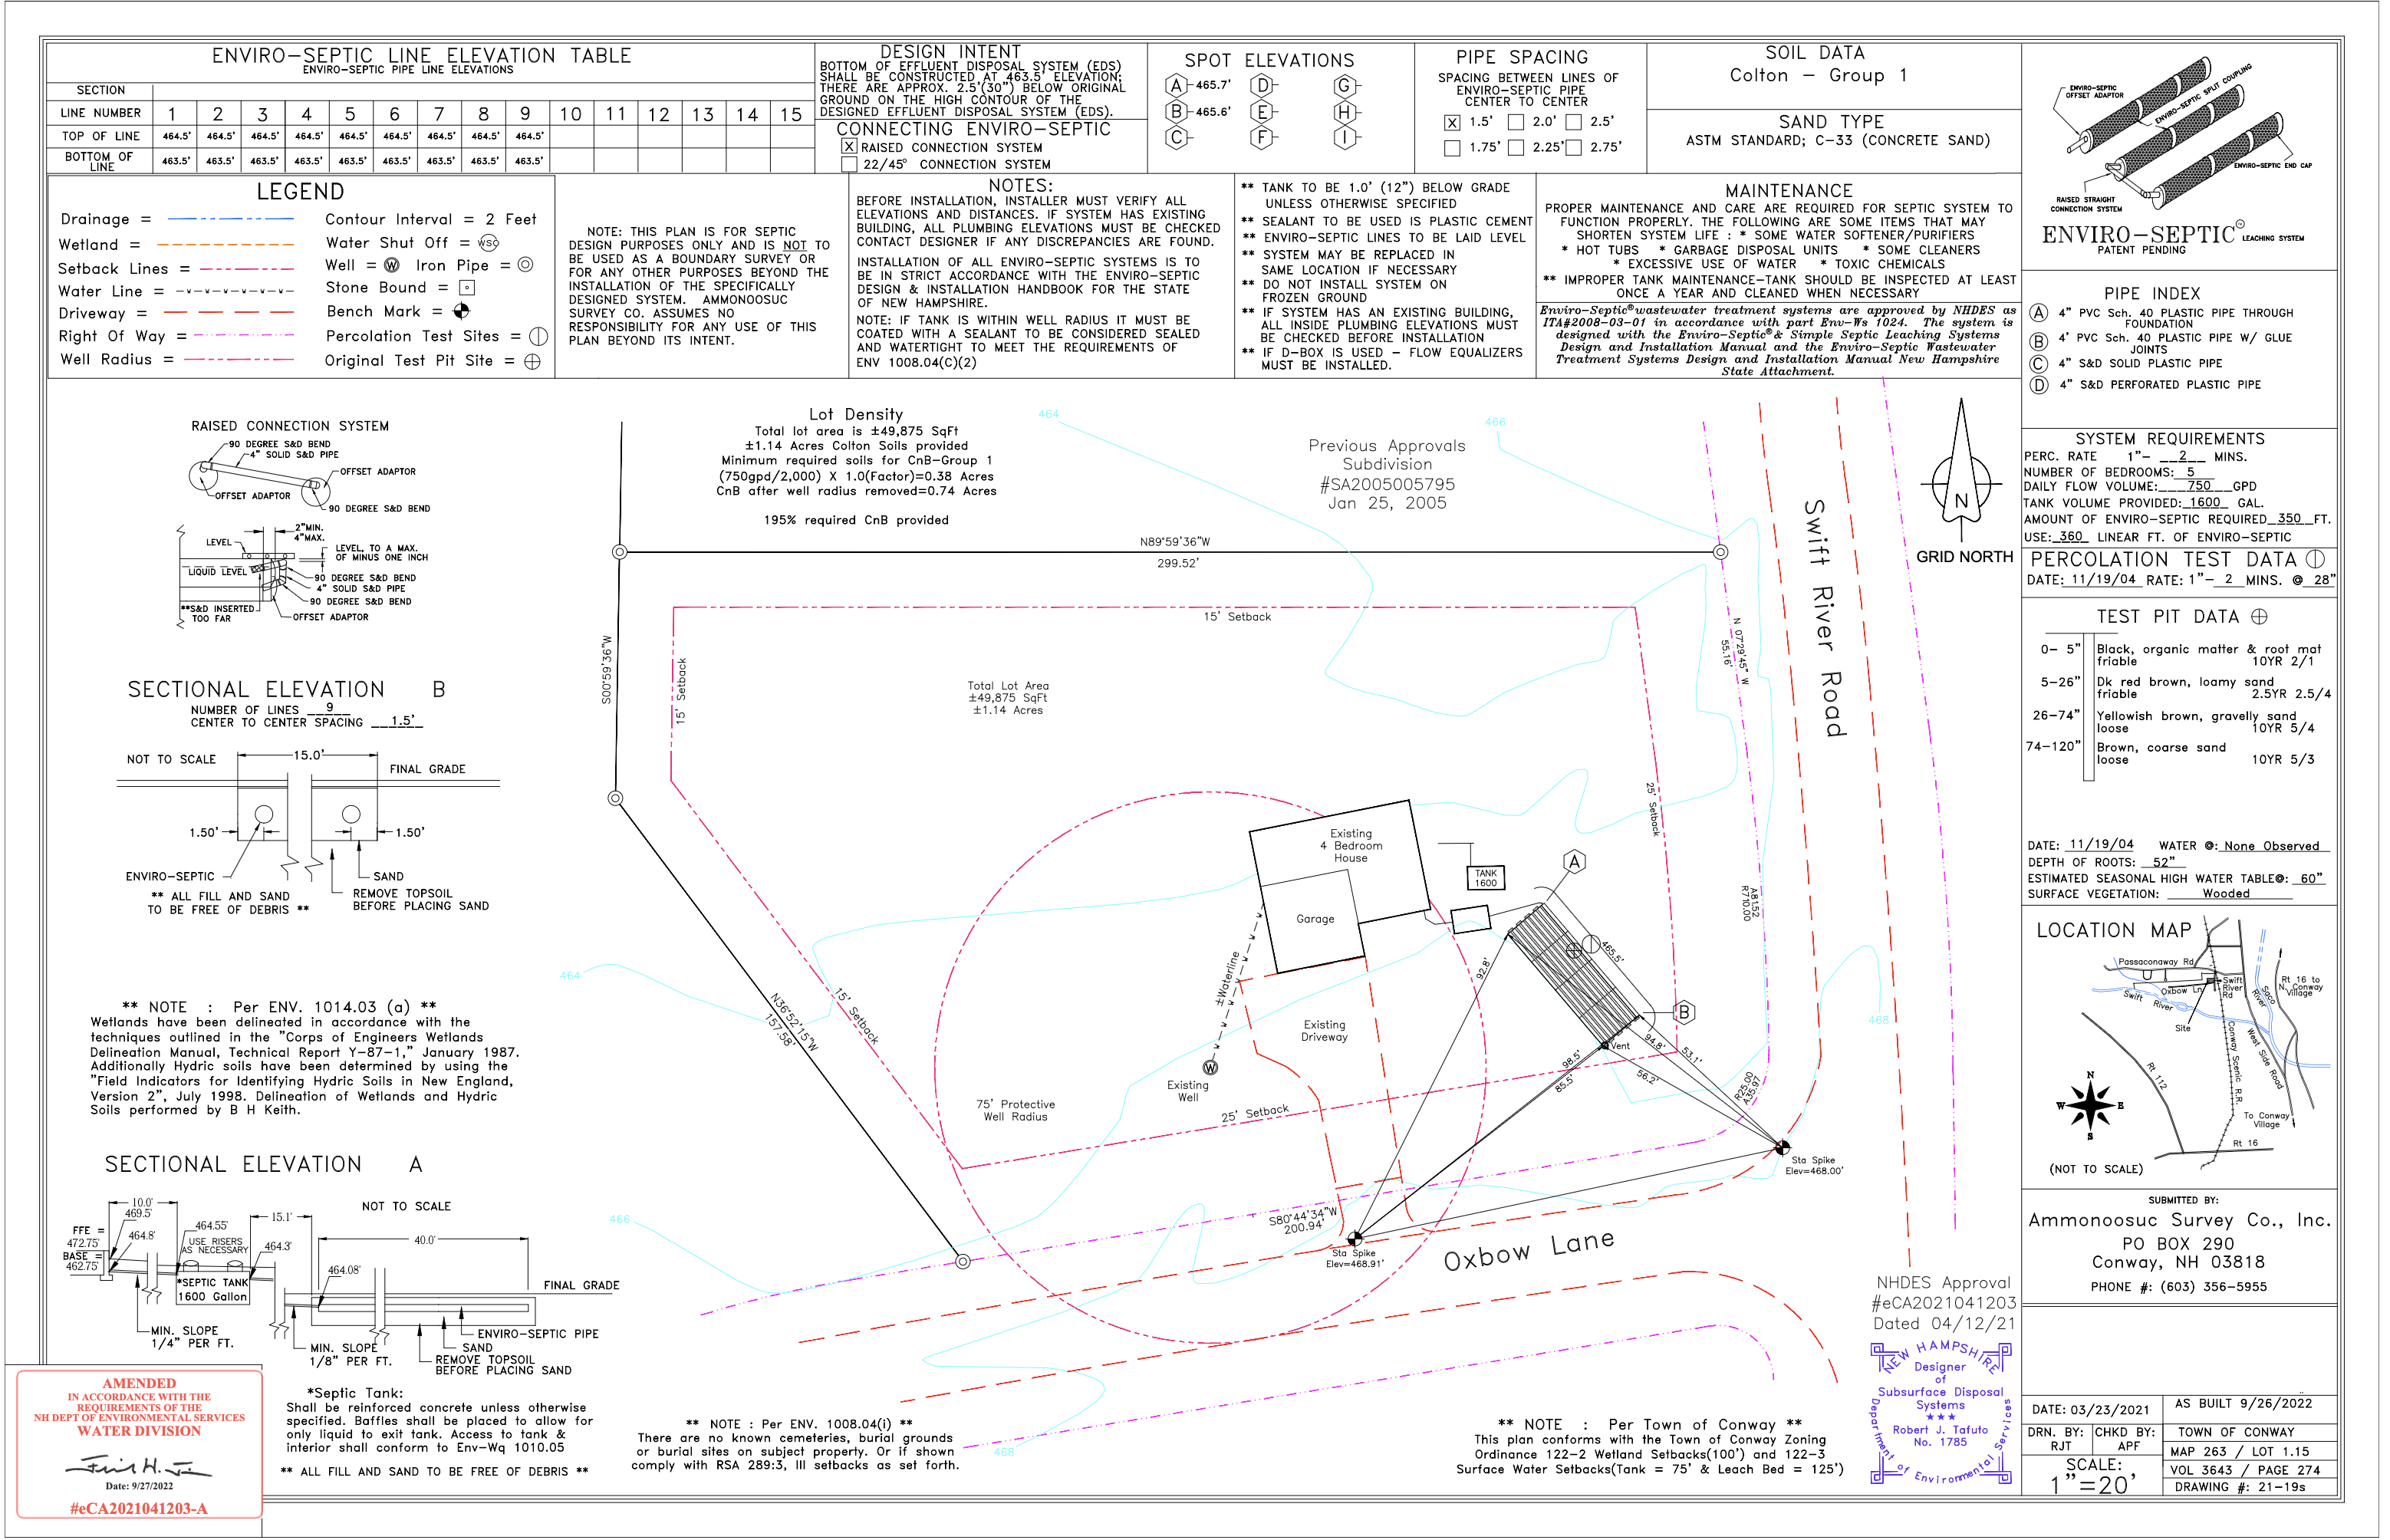
To help explain the process, we're going to examine an actual New Hampshire septic design for a five-bedroom residential property.
This particular plan includes a 1,600-gallon septic tank, an Enviro-Septic disposal system, detailed soil testing, and some interesting considerations involving wetlands, a well protection area, and the property's topography.
Let's take a closer look.
1. What Is This Septic System Designed to Handle?
The first thing I look for on a septic design is the system capacity.
This particular design specifies:
Design component | Specification |
|---|
Residential capacity | 5 bedrooms |
Daily wastewater design flow | 750 gallons |
Septic tank | 1,600 gallons |
Disposal system | Enviro-Septic |
Number of disposal lines | 9 |
Length of each line | 40 feet |
Total Enviro-Septic pipe | 360 linear feet |
Minimum pipe requirement listed | 350 linear feet |
Soil classification | Colton — Group 1 |
Percolation rate | 1–2 minutes per inch |
Estimated seasonal high water table | 60 inches |
Property area | Approximately 1.14 acres |
These specifications tell us quite a bit about the system before we even examine the site drawing.
Perhaps the most important number is the five-bedroom capacity.
Why are septic systems sized by bedrooms?
In residential septic design, the number of bedrooms is used to estimate potential occupancy and wastewater production.
The idea is that a five-bedroom home has the potential to accommodate more occupants than a two-bedroom home, even if only a couple of people currently live there.
The system needs to be designed around the anticipated wastewater load associated with the approved residential use.
In this example, the design calls for 750 gallons per day.
That works out to:
750 gallons ÷ 5 bedrooms = 150 gallons per bedroom per day.
That is the design-flow assumption reflected in this plan, not a prediction of actual daily water consumption.
A household might use considerably less water on a typical day.
But the system is designed to accommodate the established wastewater loading requirement.
Why does this matter to buyers?
Imagine purchasing a four-bedroom home with a large finished basement.
The basement has a room that could easily function as another bedroom.
Before advertising the property as a five-bedroom home or converting that space for additional occupancy, it's worth confirming the approved septic capacity.
A house having five rooms that could be used as bedrooms doesn't necessarily mean the septic system is approved for five bedrooms.
Likewise, a home with three bathrooms doesn't automatically need a different septic capacity than a comparable home with two bathrooms.
The design capacity and approved use are what matter.
2. The Septic Tank: Why 1,600 Gallons?
This design specifies a 1,600-gallon septic tank.
That's a substantial tank, particularly when you consider that the design wastewater flow is 750 gallons per day.
The tank's nominal capacity is more than twice the daily design flow.
But a septic tank is more than a container that holds wastewater.
It's the first treatment stage of the system.
What happens inside a septic tank?
When wastewater leaves the house, it flows into the septic tank.
Inside, three primary layers develop.
Scum: Grease, oils, fats, and other floating materials collect near the top.
Effluent: The liquid portion occupies the middle of the tank.
Sludge: Heavier solids settle to the bottom.
The tank allows solids to separate from the wastewater before the liquid moves into the disposal system.
Without that separation, excessive solids could enter the leach field and contribute to clogging.
The engineering notes on this design also specify that the tank should be constructed of reinforced concrete unless otherwise noted.
An outlet baffle is required so that primarily liquid wastewater leaves the tank rather than floating material or settled solids.
Does a larger septic tank mean less maintenance?
A larger tank may provide additional capacity for solids accumulation, but it doesn't eliminate the need for inspections or pumping.
Eventually, sludge and scum need to be removed.
The engineering drawing recommends inspecting the tank at least annually and cleaning it when necessary.
It's also important to recognize that the tank and leach field do different jobs.
The tank separates and retains solids.
The leach field disperses and provides additional treatment of the liquid wastewater.
Both components need to function properly.
3. What Is an Enviro-Septic System?
This design uses an Enviro-Septic leaching system rather than a conventional stone-and-pipe disposal field.
Enviro-Septic systems use specially manufactured perforated pipe with surrounding treatment and filtration materials.
The plan includes a diagram of the pipe assembly, showing how the components fit together.
Wastewater leaving the septic tank moves through the Enviro-Septic piping.
As the wastewater enters the specially designed pipe, the system distributes it through the surrounding materials and ultimately into the approved sand and soil.
The design allows biological treatment processes to occur as wastewater moves through the system.
Naturally occurring microorganisms help break down organic material, while the surrounding soil provides additional filtration and treatment.
How is this different from a traditional leach field?
A conventional septic system commonly uses perforated pipe installed within crushed stone or another approved dispersal medium.
The wastewater passes through the pipe, enters the surrounding aggregate, and then moves into the soil.
Enviro-Septic systems use manufactured pipe and treatment media arranged to provide a different method of wastewater distribution and treatment.
The engineering drawing specifies that the installation must follow the applicable Enviro-Septic design and installation handbook.
This is important because the materials, elevations, spacing, and installation requirements are specific to the system being used.
A contractor cannot simply substitute standard perforated pipe and assume the design will function the same way.
4. Nine Lines of Septic Pipe: Why So Many?
The engineering plan calls for nine lines of Enviro-Septic pipe.
Each line is 40 feet long.
That gives us:
9 lines × 40 feet = 360 linear feet of Enviro-Septic pipe.
The system requirements section identifies 350 linear feet as the amount required under the design calculation.
The proposed system therefore provides ten additional linear feet beyond that listed requirement.
Why is the total length important?
The disposal field needs enough approved dispersal capacity to accommodate the anticipated wastewater load.
The amount of pipe depends on several factors, including the wastewater design flow, soil conditions, type of system, and manufacturer's approved sizing method.
Simply installing more pipe isn't automatically better.
The system needs to be appropriately sized and arranged.
What about spacing between the pipes?
The plan specifies that the nine lines are installed with 1.5 feet of center-to-center spacing.
The sectional drawing shows the arrangement of the pipes within a disposal area approximately 15 feet across.
The pipes are surrounded by approved sand.
The plan specifically identifies the sand as ASTM C-33 concrete sand.
This is not simply whatever sand happens to be available at the local gravel pit.
The type and quality of sand matter because the material affects how wastewater moves through the system.
Poorly selected fill material can change drainage characteristics and interfere with the intended performance.
Why is the spacing so precise?
The pipe layout influences how wastewater is distributed throughout the field.
Crowding the pipes too closely, changing their elevations, or installing them at an improper slope can affect system performance.
That's why the engineer specifies exact distances and elevations.
The installer is expected to follow those dimensions rather than relying on visual estimates.
5. Soil Testing: One of the Most Important Parts of the Design
One of the most revealing sections of this drawing is the soil test data.
The plan identifies the soil as:
Colton — Group 1
Colton soils are generally associated with coarse-textured, well-drained material.
In this particular test pit, the evaluator documented the following layers:
Depth | Soil description |
|---|
0–5 inches | Black organic material and root mat |
5–26 inches | Dark reddish-brown, friable loamy sand |
26–74 inches | Yellowish-brown, loose gravelly sand |
74–120 inches | Brown, loose coarse sand |
This is a particularly interesting soil profile.
Below the upper organic material and loamy sand, the evaluator encountered substantial layers of gravelly and coarse sand.
These materials can allow water to move through the soil relatively quickly.
But faster drainage isn't the only consideration in septic design.
The soil also needs to provide appropriate wastewater treatment.
Why are the different soil layers important?
Wastewater doesn't disappear when it leaves the leach field.
It moves through the surrounding and underlying soil.
As it travels, various physical, biological, and chemical processes help reduce contaminants.
Different soil materials affect how water moves and how much opportunity there is for treatment.
For example, coarse sand typically allows water to pass through more quickly than dense clay.
But very rapid movement can also create concerns if there isn't enough appropriate treatment before wastewater reaches groundwater.
The designer needs to consider both the soil's ability to accept wastewater and its ability to support the required treatment processes.
What does friable mean?
The soil description refers to friable loamy sand.
Friable simply means the soil crumbles relatively easily.
It isn't tightly compacted or cemented together.
That characteristic, along with texture and structure, helps a soil evaluator understand how the material behaves.
These details might seem insignificant to someone purchasing a home, but they're important pieces of information when designing a wastewater system.
6. The Percolation Test: 1–2 Minutes Per Inch
The plan includes a percolation test performed on November 19, 2004.
The reported result was:
1–2 minutes per inch at a depth of 28 inches.
That represents relatively fast water movement during the test.
A percolation test is used to evaluate how quickly water moves through the soil under specified conditions.
Generally speaking, sandy soils tend to allow water to pass through more readily than soils containing substantial amounts of clay.
The result here is consistent with the sandy and gravelly soil profile documented in the test pit.
Is faster drainage always better?
Not necessarily.
It's tempting to think that the faster water drains, the better the septic system will work.
But septic treatment is more complicated.
The soil must accept wastewater at an appropriate rate while also providing adequate treatment.
Very slow drainage can cause wastewater to accumulate.
Very rapid drainage can present different concerns, particularly where groundwater separation or treatment conditions are limited.
That's why a percolation test alone doesn't determine septic suitability.
The evaluator also needs to consider groundwater, restrictive soil layers, available area, setbacks, and other site characteristics.
One interesting point about this design is that the original percolation testing occurred years before the septic approval.
That doesn't automatically invalidate the data, but it illustrates why buyers reviewing older plans should confirm whether the information remains acceptable under current requirements and whether site conditions have changed.
7. Groundwater: What Does a Seasonal High Water Table of 60 Inches Mean?
The test pit documentation identifies an estimated seasonal high water table at 60 inches below the ground surface.
That's five feet.
The evaluator also recorded that no water was observed in the test pit during the November 2004 evaluation.
Those are two different observations.
Not seeing water during a particular test doesn't establish that groundwater will remain below that depth throughout the year.
An estimated seasonal high water table reflects the evaluator's assessment of how high groundwater may rise during wetter conditions.
Why does groundwater matter?
A septic system needs appropriate vertical separation between the wastewater dispersal area and groundwater or other limiting conditions.
The soil beneath the disposal field is an important part of the treatment process.
If wastewater reaches groundwater without adequate treatment, contaminants can potentially migrate.
The design must therefore account for the position of the disposal field relative to the expected groundwater conditions.
In this case, the estimated seasonal high water table is one of the factors incorporated into the system design.
Does five feet of separation mean there are no groundwater concerns?
No.
It is a useful site observation, but the actual treatment separation depends on the installation elevations and the applicable design requirements.
The groundwater measurement also isn't a guarantee that conditions will remain unchanged.
Grading, drainage alterations, and other changes can influence how water behaves on a property.
Buyers should understand the difference between a soil evaluation and a guarantee of future groundwater conditions.
8. How the Elevations Control the Entire System
One of the more technical portions of this plan is the elevation information.
The designer provides measurements for the home, septic tank, piping, and disposal field.
These aren't arbitrary numbers.
They determine how wastewater moves through the system.
Some of the notable elevations shown include:
Component | Elevation |
|---|
Finished floor elevation | 472.75 feet |
Septic tank base | 462.75 feet |
Top of Enviro-Septic lines | 464.5 feet |
Bottom of Enviro-Septic lines | 463.5 feet |
The engineering drawing also identifies additional spot elevations and piping elevations.
Why are these measurements important?
Most residential septic systems rely heavily on gravity.
Wastewater needs to move from the house to the tank and then toward the disposal system.
If the elevations aren't correct, wastewater may not flow as intended.
The sectional drawing specifies a minimum slope of 1/4 inch per foot for one portion of the piping and 1/8 inch per foot for another.
These are small measurements, but over the length of a pipe, they matter.
A pipe installed with insufficient slope may not drain properly.
Likewise, installing a pipe at an elevation that conflicts with the disposal field can create problems.
Why does the plan show the septic field at a different elevation from the house?
The property isn't perfectly flat.
The designer needs to work with the existing topography while ensuring the system is installed at appropriate elevations.
The engineering notes indicate that portions of the disposal system are situated below the original ground on the higher side of the field.
This is one reason septic designs contain cross-sectional drawings.
A site plan shows where the system goes.
A cross-section shows how it fits vertically into the ground.
Both are necessary to understand the design.
9. What Is a Raised Connection System?
The plan includes a separate detail labeled Raised Connection System.
This refers to the connection arrangement used to introduce wastewater into the Enviro-Septic piping.
The detail shows components including offset adapters, four-inch solid piping, and bends.
It also illustrates how the piping connects to the system at a specified elevation.
Why is that important?
Because wastewater needs to enter the disposal system in a controlled way.
The connection cannot simply be improvised with whatever fittings happen to be available.
The detail provides installation guidance for how the connections are supposed to be assembled.
The plan also states that if a distribution box is used, flow equalizers must be installed.
These components help manage how wastewater is distributed among the disposal lines.
Uneven distribution can place more wastewater into one portion of a field than another.
Proper distribution helps the disposal area operate according to its intended design.
10. Lot Size: Why 1.14 Acres Doesn't Tell the Whole Story
The property contains approximately 49,875 square feet.
That's about 1.14 acres.
At first glance, that may seem like plenty of space for a home and septic system.
But acreage alone doesn't tell us how much land is actually suitable for wastewater disposal.
The drawing includes a lot-density calculation.
According to the engineering notes:
Total property area: approximately 1.14 acres.
Required qualifying soil area under the calculation: approximately 0.38 acres.
Qualifying soil area after the well-radius deduction: approximately 0.74 acres.
Qualifying area provided: approximately 195% of the required amount.
This is an important distinction.
The calculation isn't simply based on the entire property area.
It considers qualifying soils and deductions associated with the well protection area.
What does that mean for someone buying vacant land?
Imagine two properties that are each approximately one acre.
One has suitable soils, favorable topography, and relatively few setbacks.
The other has wetlands, a steep slope, a well protection area, and limited suitable soil.
Those properties may have very different development potential.
Acreage is important, but the quality and characteristics of that acreage can matter even more.
A septic design helps establish whether a particular portion of the property can accommodate a proposed wastewater disposal system.
11. Wetlands and Septic Setbacks
Another particularly interesting feature of this design is the presence of delineated wetlands.
The plan includes wetland boundaries and identifies the methods used to determine those boundaries.
It also illustrates property setback lines and a 75-foot protective well radius.
Why does this matter?
Because a septic system cannot necessarily be installed wherever the property owner would prefer.
The designer has to account for separation distances from features such as wells, wetlands, property boundaries, and other protected resources.
These setbacks exist to help protect drinking water and surrounding environmental resources.
The precise requirements depend on the type of resource, applicable state and local regulations, and site-specific circumstances.
What is wetland delineation?
Wetland delineation is the process of identifying wetland boundaries using factors such as vegetation, soils, and hydrology.
A property doesn't need to have standing water or a visible swamp to contain wetlands.
Some wetlands may appear relatively dry during portions of the year.
That can be surprising for buyers walking a wooded parcel during summer or fall.
The engineering plan illustrates why identifying wetlands early is important.
The location of protected areas can influence where a septic system, driveway, and home can be situated.
Does the presence of wetlands mean a property can't be developed?
Not automatically.
A property may contain wetlands and still have sufficient suitable upland area for development.
The important question is whether the proposed improvements can comply with the applicable regulations and site constraints.
This example shows how the designer incorporated the location of wetlands, a well radius, and other features into the overall septic layout.
12. The Relationship Between the House, Driveway, and Septic System
One of the useful features of the site drawing is that it shows the improvements together.
The septic system isn't simply placed in an empty rectangle somewhere on the property.
The design identifies the home, driveway, septic tank, and disposal area.
This matters because these improvements have to coexist.
The house must have an appropriate wastewater connection.
The septic tank needs to be accessible for maintenance.
The disposal field must be located in suitable soil.
And future improvements shouldn't interfere with the wastewater system.
Why does the leach field location matter to homeowners?
Once installed, the disposal area should be protected.
Driving heavy vehicles over the field, building structures on top of it, or changing the grading can create problems.
The same applies to directing additional stormwater into the area.
Homeowners considering a garage, addition, pool, or driveway expansion should understand where the septic components are located.
Sometimes the location of the septic system can limit future projects.
That's why knowing where everything is installed can be just as important as knowing the system's capacity.
13. What Does It Mean That the Plan Is Marked "As Built"?
Here's something particularly interesting about this engineering document.
The plan includes an original New Hampshire Department of Environmental Services approval dated April 12, 2021.
It also shows an amended approval dated September 27, 2022.
The title block identifies the drawing as:
"As Built 9/26/2022."
This distinction is important.
Proposed septic design
A proposed design shows how the system is intended to be constructed.
It identifies the required materials, layout, dimensions, and elevations.
As-built septic documentation
An as-built drawing is intended to reflect the configuration of the system as constructed.
During installation, it may become necessary to document changes or confirm final measurements.
Those differences may need to be reviewed by the designer and appropriate authorities.
Why do buyers benefit from as-built plans?
Because the originally proposed layout and actual installation aren't always identical.
An as-built drawing can provide useful information about the location and configuration of the installed system.
That's particularly valuable when planning future improvements or investigating a maintenance concern.
The amended state approval stamp on this plan provides additional documentation of the revised design.
However, even an as-built drawing doesn't establish the system's present condition or guarantee that it's functioning properly years later.
For that, buyers may want a qualified septic inspection.
14. What Maintenance Does an Enviro-Septic System Require?
Advanced wastewater dispersal technology doesn't eliminate the need for maintenance.
The plan's maintenance notes address several important concerns.
These include limiting unnecessary water loading, avoiding certain chemicals, and maintaining the septic tank.
Some common practices can place additional stress on a septic system.
Excessive water use: Large or unusual wastewater discharges can increase the load on the system.
Garbage disposals: These can introduce additional solids into the wastewater stream.
Improper chemical disposal: Certain chemicals can interfere with biological treatment processes or damage components.
Neglected tank pumping: Excess solids can eventually migrate beyond the tank.
Poor surface drainage: Directing excessive rainwater or runoff toward the field can interfere with wastewater dispersal.
Driving over the disposal field: Vehicle traffic can damage buried components or compact the surrounding soil.
A properly designed system still needs to be used appropriately.
And because these are manufactured Enviro-Septic components, owners should follow the applicable manufacturer's maintenance recommendations.
15. Can You Increase the Bedroom Capacity Later?
One of the most common questions buyers ask about septic systems is whether they can add bedrooms.
In this example, the system was designed for five bedrooms.
But what if the owner wanted to convert part of the home into additional sleeping space?
Could the property become a six-bedroom home?
Possibly, but not automatically.
The existing design would need to be evaluated to determine whether it could accommodate the proposed change.
Increasing the number of bedrooms may require a revised wastewater design, additional approval, or modifications to the system.
The fact that a septic field has more pipe than the listed minimum requirement doesn't necessarily mean there's unused capacity available for an additional bedroom.
The system's approval and overall design control its permitted residential capacity.
Buyers should never assume that having a physically large septic system automatically allows unlimited bedrooms.
16. What Buyers Should Look for When Reviewing a Septic Design
When reviewing a septic design, there are several questions worth asking.
How many bedrooms is the system designed for?
This is one of the most important details, particularly when purchasing a home with finished basement space or plans for future expansion.
What type of system is installed?
A conventional stone-and-pipe system, chamber system, Enviro-Septic system, or other approved technology may have different installation and maintenance requirements.
How large is the septic tank?
Tank capacity is important, but it should be evaluated along with the approved design and condition of the system.
What do the soil tests show?
The soil profile, percolation rate, groundwater findings, and limiting conditions help explain why the system was designed the way it was.
Is the system located near wetlands or other protected resources?
Setbacks may affect where future improvements can be built.
Is there an as-built plan?
An as-built drawing may help identify the actual location and configuration of installed components.
Has the system been inspected recently?
An approved design and as-built documentation provide valuable historical information, but they aren't substitutes for evaluating the current system.
Are there records of maintenance and pumping?
Maintenance records can help buyers understand how the system has been cared for.
Can the system accommodate future changes?
Buyers considering additions, additional bedrooms, or changes in use should confirm their plans with a qualified designer and the appropriate permitting authorities.
17. Why Septic Documentation Matters When Selling a Home
From a real estate perspective, this is an area where sellers can make the transaction considerably easier.
When a buyer has questions about the septic system, having the relevant documentation readily available can be extremely helpful.
That may include:
The approved septic design.
As-built drawings.
Septic inspection reports.
Pumping and maintenance records.
Documentation of repairs or modifications.
These records help buyers better understand what they're purchasing.
They may also reduce the need to track down information late in the transaction.
In New Hampshire, where many properties rely on private septic systems, I think this is an important part of preparing a property for sale.
A buyer shouldn't have to guess about the septic system if useful documentation already exists.
And a seller who can provide organized information may make the due diligence process considerably smoother.
The Bottom Line: A Septic Plan Tells a Story About the Property
This five-bedroom septic design is a particularly good example of how much information is contained in an engineering plan.
It specifies a 1,600-gallon tank, 750 gallons of daily design flow, nine lines of Enviro-Septic pipe, and 360 linear feet of disposal piping.
It documents sandy and gravelly soils, a percolation rate of one to two minutes per inch, and an estimated seasonal high water table approximately five feet below the surface.
It also addresses property boundaries, wetlands, a well protection area, and the relationship between the home and disposal field.
And because the drawing includes as-built information and an amended state approval, it provides additional insight into the system's documented installation.
Every one of those details helps explain how the wastewater system was designed to function on that particular property.
For buyers, understanding a septic plan can help answer questions about bedroom capacity, soil conditions, system configuration, and future development possibilities.
For sellers, having that documentation available can be a valuable part of preparing the home for the market.
A septic system may be mostly invisible once it's buried, but it's one of the most important parts of a home that doesn't have public sewer service.
Understanding what's underground is just as important as understanding what's above it.
At North Conway Realty, we help buyers and sellers navigate real estate transactions throughout New Hampshire's Mount Washington Valley. Septic designs are one of many important documents that can help buyers better understand a property's features, limitations, and potential.
This article uses an actual New Hampshire septic engineering drawing as an educational example. Property owner information has been omitted. The technical specifications apply to this particular design and should not be interpreted as universal requirements for all properties. Buyers and homeowners should consult qualified septic professionals and the appropriate permitting authorities regarding specific systems.